
Configuring a filter in ELK Stack
Having feasibility and access to various logging and monitoring information from a running application is crucial for debugging issues and overseeing any security-related activities. Elasticsearch, Logstash, and Kibana (ELK) are widely adopted tools in the enterprise for indexing, ingesting, and visualizing large amounts of log data generated by applications deployed in different environments.
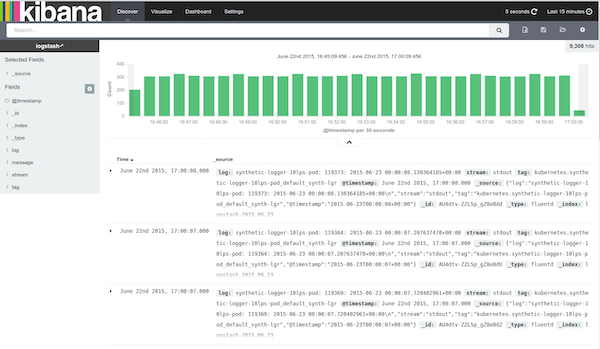
To familiarize yourself with the ELK stack, I recommend installing it locally and experimenting with different configurations until you achieve the desired outcomes with these services.
Installation of ELK Stack:
1. Windows, macOS, or Linux:
- For Linux, you can install the required software using RPM or YUM commands. In other operating systems, you can download the zip file and extract it to a location on your local drive.
- Visit the following site, "Install Elasticsearch," to download the desired version of the application.
2. Configuration Changes:
- After installation, modify the Elasticsearch, Logstash, and Kibana configuration files. These files typically have .yml extensions and should be updated based on your specific requirements.
3. Starting the Services:
- Once the necessary configurations are updated, start the ELK stack services by navigating to the downloaded folder's executable file.
- For example, to start Elasticsearch:
- Go to the bin directory and execute the elasticsearch command. On macOS, you would run `./elasticsearch` from the bin directory.
- Elasticsearch will run at http://localhost:9200.
- To start Kibana:
- Run Kibana from the bin directory.
- Kibana will run at http://localhost:5601.
- To start Logstash:
- Run Logstash from the bin directory.
- If you have configured Logstash to send logs to Elasticsearch, it will send the logs to the defined Elasticsearch instance.
4. Logstash Configuration:
- To configure Logstash, you need to create a configuration file.
- After creating the configuration file, execute the following command:
- `logstash -f configfile`
- The configuration file follows the format:
```
input {}
filter {}
output {}
```
5. Creating a Filter:
- In order to visualize logs or other data sources in Kibana, the data needs to be formatted for easier visualization. Filters can be used for this purpose.
- The filter has the following format:
```
input {
stdin {}
}
filter {
grok {
match => { "message" => "%{COMBINEDAPACHELOG}" }
}
date {
match => [ "timestamp" , "dd/MMM/yyyy:HH:mm:ss Z" ]
}
}
output {
elasticsearch {
hosts => ["localhost:9200"]
}
stdout {
codec => rubydebug
}
```
- The input can be any source; in this example, we use `stdin{}` but it can also be a file location.
- The filter defines the patterns to be applied to the incoming data. In this case, we create a grok pattern that creates a `message` field for the incoming log file. However, the pattern can be more specific, allowing you to separate the incoming data into different fields.
6. Testing the Grok Pattern:
- There are multiple ways to test the grok pattern:
1. In Kibana, you can use the Dev Tools feature to input your data or log and apply the grok patterns. You can then observe the output after the patterns are applied to the incoming data.
2. Online resources are available where you can test your grok patterns.
Setting up a local ELK instance provides several advantages